Effects of Hypotonic and Isotonic Sports Drinks on Endurance Performance and Physiology Darrell L Bonetti1, Will G Hopkins2 Sportscience 14, 63-70, 2010 (sportsci.org/2010/dlbwgh.htm) 1 Department of Physiology, Australian Institute of Sport,
Canberra 6217, Australia; 2 Sport and Recreation, AUT University, Auckland
0627, New Zealand. Email.
Reviewer: Asker Jeukendrup, School of Sport and Exercise Sciences, University
of Birmingham, Birmingham B15 2TT, UK.
|
|
In comparison with plain water, drinks containing carbohydrate and salt can enhance performance when consumed before or during high-intensity exercise lasting at least an hour (e.g., Coyle, 2004). The carbohydrate contributes to the performance enhancement by offsetting the depletion of the body's stores of carbohydrate, the main fuel for intense endurance exercise. The sodium in the drinks contributes either by accelerating the uptake of carbohydrate from the gut or by offsetting the reduction in circulating fluid volume that occurs through sweating or shift of fluid into active muscle. Stimulation of carbohydrate receptors in the mouth may also have an ergogenic effect (Carter et al., 2004; Chambers et al., 2009). Optimizing the concentrations of carbohydrate and salt for performance is a concern for sport nutritionists and drink manufacturers (Coombes and Hamilton, 2000). Higher concentrations provide more carbohydrate and salt but reduce the rate of gastric emptying and can therefore slow the rate of delivery of fluid, while hypertonic drinks can even impair performance by drawing fluid from the circulation into the gut (Maughan and Leiper, 1999). Manufacturers have opted generally for isotonic formulations, but these are not necessarily optimal. Only two studies focusing on performance have included hypotonic drinks, and the issue of their efficacy is still unresolved. Maughan and colleagues (1996) compared the effects of non-blinded consumption of water, an isotonic and a hypotonic glucose-electrolyte solution after an overnight fast. The subjects were 12 males of unstated fitness who consumed the drinks during a time-to-exhaustion test at room temperature (21 °C) and lasting ~100 min. Median or mean endurance times were longer by 9-18% for either solution vs water, but the comparison of the two solutions was unclear: median times were longer by 2.8% for the hypotonic solution, mean times were longer by 8.1% for the isotonic solution, and neither comparison was statistically significant. Subjects in the other study (Galloway and Maughan, 2000) were six fit but not specifically competitive males who performed a similar time-to-exhaustion test in a hot environment (31 °C) after an overnight fast. Here there was a clear increase in median performance time of 40% when the drink was a hypotonic glucose-electrolyte solution compared with a slightly hypertonic sucrose-electrolyte solution. However, the difference in performance could not be ascribed simply to the difference in tonicity or type of carbohydrate, because the hypotonic drink was consumed at approximately twice the rate of the other drink. When we were approached by a drink manufacturer to investigate the efficacy of their two hypotonic drinks, we designed a study in which the subjects were competitive athletes performing the exercise tests at room temperature in a more realistic non-fasted state. We included an isotonic drink and non-caloric colored flavored water in a double-blind manner to eliminate placebo effects, and we used a progressive approach in the analysis to make probabilistic inferences about magnitudes of effects (Hopkins et al., 2009). Methods
Study Design
This study employed a double-blind randomized crossover controlled design. The cyclists first performed an incremental test to peak power, followed on a separate day by a familiarization trial of the exercise test, which consisted of a 2-h pre-load at fixed intensity followed 10 min later by a maximal exercise test. They were then randomized in balanced crossover fashion to consume each of four different drinks (Table 1) during the pre-load of the exercise test. The tests were separated by 3-7 d.
Subjects
Seventeen well-trained, competitive endurance cyclists and triathletes were recruited from the greater Auckland area. One subject did not complete all tests and was excluded from the analysis. The characteristics of the remaining 16 subjects (mean ± standard deviation) were as follows: age, 34 ± 6 y; body mass, 82.0 ± 8.8 kg; peak power, 344 ± 36 W; maximum oxygen consumption, 4.3 ± 0.5 L.min‑1. All subjects gave their written informed consent in accordance with AUT University’s ethics committee. During the study all subjects were in a period of high mileage/endurance development, with the majority of subjects competing in endurances races of 2-3 hours duration each weekend. The subjects maintained their normal diet during the course of the intervention. They were instructed to have an easy day of training prior to each testing session and to consume 500 ml of water one hour prior to each session. Exercise Performance Tests
All physiological and performance tests were conducted in a temperature-controlled laboratory (19-21 °C) using a electro-magnetically braked cycle ergometer (Velotron, Racermate, Seattle, Washington). Prior to the first test, the ergometer was set up to replicate the subject's road bike as closely as possible. The settings were recorded and used for each subsequent testing session. Each cyclist initially performed an
incremental exercise test to determine peak power, which was used to set the
intensity of exercise for the five subsequent performance tests. The incremental step test commenced at a
workload of 150-180 W, depending on fitness, and increased by 30 W every 3
min until volitional exhaustion. At the end of each 3-min stage, capillary
blood was sampled from an earlobe for measurement of blood lactate using a
hand-held analyser (Lactate Pro, Arkray,
Japan). Oxygen uptake was measured
continuously using a breath-by-breath metabolic system (Metamax
3b, Cortex, Leipzig, Germany). Heart rate was recorded continuously at 5-s
intervals using a short-range telemetry device (Polar A1, Polar Electro, Kempele, Finland). Maximum oxygen uptake was determined as the
highest 30-s value obtained during the test. Each experimental ride consisted of a 2-h
pre-load bout of exercise at the same fixed workload (55-60% of peak power)
followed by a maximal cycle test.
During the 2-h pre-load the cyclists were required to maintain a
consistent cadence and were given a 5-min rest after the first hour. The maximal exercise test commenced 10 min after the 2-h pre-load at
a workload of 180 W and increased by 1 W every 2 s until volitional
exhaustion. The cyclists were not
given feedback on elapsed time or power output during the maximal exercise
test. Each cyclist performed a familiarisation
ride of the experimental procedure on one occasion while consuming their
usual drink, one week before the first experimental ride. In each of the four experimental rides the
cyclist consumed a different drink. The cyclist consumed the same volume of
each drink (250 ml) at 15-min intervals during the ride. Prior to the start of and immediately following the 2-h pre-load, capillary blood (1.5 ml) was drawn from a finger puncture and collected into tubes with lithium-heparin anti-coagulant. Osmolarity was determined from this sample by an independent commercial laboratory (Lab Plus, Auckland, NZ). Urine was also collected immediately after the blood samples and volume recorded. Volume of any urine voided during the 5-min rest period after the first hour of the pre-load was also recorded. A 50-ml sample from each collection period was sent to the independent laboratory for determination of osmolarity. Prior to the start of, after one hour, and immediately following the 2-h pre-load, body mass was determined in minimal clothing using digital scales (Model HW-G, A&D Mercury, Thebarton, Australia). Sweat volume was then inferred from change in body mass, taking account of fluid consumption and urine production. Statistics
Data were analyzed using mixed linear models in the Statistical Analysis System (Version 9, SAS Institute, Cary NC). In addition to the fixed nominal effect for the different drinks, the models included a fixed nominal effect for the order of the drink trials and covariates to adjust for the effect of within-subject between-trial changes in ambient temperature and pre-test urine osmolarity (with pre-test serum osmolarity replacing pre-test urine osmolarity in the analysis of serum osmolarity). These covariates were analyzed by setting each subject's mean to zero, and their magnitudes were evaluated as the effect of two within-subject standard deviations (the square root of the mean within-subject variance). All models included a random effect for subject identity and a random effect to account for additional error on the first trial. The models for analysis of data from the pre-load included a random effect for within-subject between-trial variation, and the residual was the within-subject within-trial error of measurement. The residual in the models for the analysis of data from the maximum test was the within-subject between-trial error of measurement. We used the magnitude-based
approach to inferences: clinical for performance and mechanistic for the
physiological variables (Hopkins et
al., 2009). With
clinical inferences, an effect with possible benefit (>25% chance) was clear
if harm was very unlikely (odds ratio of benefit/harm >66) and unclear
otherwise; other effects were clearly not beneficial. With mechanistic
inferences, an effect was deemed unclear if its 90% confidence interval
overlapped thresholds for substantiveness (that is, if the effect could be
substantially positive and negative); other effects were clear. The
thresholds for the mechanistic variables were the usual standardized
differences, using the average between-subject standard deviation derived
from the mixed model. The thresholds for the performance test were derived
using the following novel rationale: the individualized preload was assumed
to bring the subjects to a state of fatigue similar to that of cyclists in
the first peloton of a road race near the end of the race; performance in the
incremental test was assumed to simulate the physical demands of an extended
sprint to the finish in a road race;
an individual subject's percent variation in performance from trial to
trial was assumed to be similar to the percent variation that the cyclists in
the first peloton would experience between competitions; the threshold for
smallest important change in performance was therefore given by 0.3 of the
within-subject variation from trial to trial, while those for moderate and
large effects were given by 0.9 and 1.6 of the within-subject variation (Hopkins et
al., 2009). Results
Performance in the incremental test following the 2-h steady ride and physiological measures taken at the end of the test are shown in Table 2 for each of the four drinks. Table 3 shows the comparison of the means of these measures between Mizone Rapid and each of the other drinks.
The error of measurement of peak power derived
from the linear model was 4.1% (90% confidence limits פ¸1.26),
and the resulting thresholds for small, moderate and large changes in
performance were 1.2%, 3.7% and 6.6% respectively. The highest peak power in
the incremental test occurred with Mizone Rapid and Powerade; the observed
difference between these drinks was possibly trivial, but there was too much
uncertainty for the comparison to be clear.
On the other hand, peak power with Mizone Rapid was very likely higher
(98% chance) than that with water, and the difference was possibly moderate
(68% chance). The difference in peak power between Mizone Rapid and Mizone
was likely to have been substantial but small (87% chance). Peak heart rate and lactate following the
incremental test were also highest in the trials conducted with Mizone Rapid
and Powerade, and peak glucose was highest with Powerade. There was a clear
reduction in blood osmolarity with water relative to the other drinks after
the performance test, but differences between Mizone Rapid, Mizone and
Powerade were unclear. Mizone Rapid
produced the lowest urine osmolarity and the greatest urine volume after the
performance test compared to the other drinks. The effects of 2 SD of covariates in the
analysis of the incremental test were either trivial or unclear, with the
following exceptions: a 1.3 °C increase in ambient temperature was
associated with a small increase in peak lactate of 18% (90% confidence
limits ±14%); a 2.8% increase in pre-test serum osmolarity tracked almost
perfectly into a 2.7% increase in post-test serum osmolarity (±1.0%); and a
3.1-fold increase in pre-test urine osmolarity was associated with a small
reduction in urine volume, by a factor of 0.69 (0.53 to 0.88) and a small 14%
increase in sweat volume (±11%).
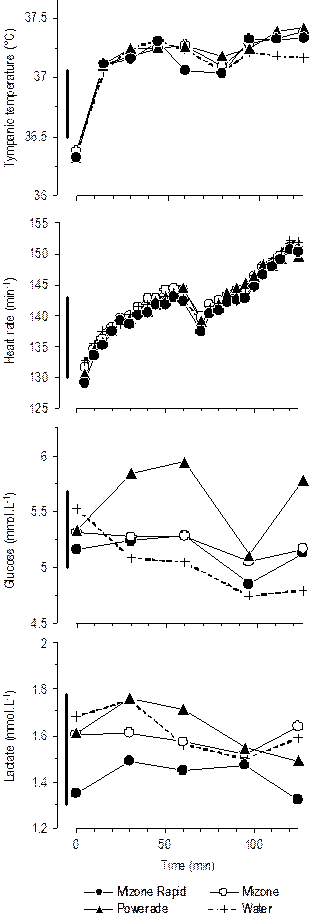
Mean values of measures taken during the
steady ride are shown in Figure 1. There were no obvious consistent differences
between drinks in the changes in tympanic temperature and heart rate during
the ride. Differences in the mean
tympanic temperature were trivial (up to 0.11 °C)
but unclear (90% confidence limits ~±0.18; threshold for small 0.12 °C).
Mean heart rate with Mizone Rapid was 1.0-1.3 min-1 less than
with any other drink, but this difference was probably trivial (90%
confidence limits ±2.2; threshold for small 2.6 min-1). Mean blood glucose was highest for Powerade,
by a clear moderate-large amount (0.56-0.79; ±0.58; threshold for
small 0.12 mmol.L-1), but the differences between Mizone Rapid
and water or Mizone were small or trivial respectively. Lactate concentration
was also highest with Powerade (1.65 mmol.L-1), and lowest for
Mizone Rapid (1.47 mmol.L-1), this difference being only small
(confidence limits and threshold for small, ±0.15 and 0.10 mmol.L-1). Not apparent in Figure 1 is the effect of
the ambient temperature as a covariate on the mean value of each variable. An
increase of two standard deviations in ambient temperature (1.3 °C)
was associated with a clear small increase in tympanic temperature (0.18°C;
90% confidence limits ±0.07°C) and a trivial-small increase in heart rate (2.5;
±0.6 min-1).
Effects of this covariate on blood glucose and blood lactate and effects of
pre-exercise urine osmolarity as a covariate on all four variables were not
noteworthy. Discussion
In this study consumption of a hypotonic carbohydrate-electrolyte
drink may have produced a moderate enhancement of endurance performance in
comparison with a water placebo. A
small benefit was also likely in comparison with a hypotonic drink containing
only carbohydrate, but performance was possibly similar to that with an
isotonic carbohydrate-electrolyte drink. The incremental test we used
following a pre-load should represent a good simulation of the energy demands
in the closing stages of a cycle road race lasting several hours. Our
quantitative inferences are based on the assumption that the variability in performance
cyclists showed between trials in the test would be similar to that in such
races. Irrespective of this assumption, it seems reasonable that the effects
of ~2-4% we observed here would be important, considering that effects of ~1%
are important in endurance time trials (Hopkins
et al., 1999). Test protocols can have profound effects on performance outcomes and
errors of measurement (Hopkins
et al., 2001), making it difficult to compare magnitudes of
performance effects in different studies.
Here we used a submaximal pre-load of fixed duration and intensity,
which amplifies effects in a subsequent performance test (Hopkins
et al., 2001). We also
opted for an incremental test rather than the more usual time trial following
the pre-load, because we wanted to eliminate noise and bias arising from
difficulty subjects might have in choosing an appropriate pace following a
pre-load. The resulting error of
measurement of ~4% in the test is about three-fold more than the ~1-2%
usually observed for peak power in incremental tests when there is no
pre-load (Hopkins
et al., 2001). It seems reasonable to assume that the pre-load
caused a similar amplification of effects on peak power, and if we also
assume that performance in an incremental test reflects performance in a time
trial (an assumption the reviewer of this article challenged), we can infer
that the two glucose-electrolyte solutions would have enhanced performance in
an aerobic time trial by ~1-2% relative to water. The effects we observed are therefore
comparable with the 2.3% effect on mean power for a glucose-electrolyte drink
relative to a water placebo in a 1-h time trial (Jeukendrup et al., 1997). The
9-18% effects on times to exhaustion lasting ~100 min in the study of Maughan et al. (1996) are also of similar magnitude, when these are
divided by 10-15 to convert them to effects in a time trial (Hopkins
et al., 2001). Our findings are consistent with other evidence of the importance of
both carbohydrate and sodium for the absorption of drinks from the gut (e.g.,
Brouns and Kovacs, 1997). While
we did not measure carbohydrate or fluid absorption directly, some of our
results provide indirect evidence for faster water absorption of Mizone
Rapid: it produced the lowest urine osmolarity and the greatest urine volume
after the performance test, suggesting earlier excretion and therefore
earlier absorption than the other drinks. Blood osmolarity at the end of each
test did not provide clear evidence of differences in absorption and
excretion of water and osmolytes in the drinks: the lowest osmolarity with water could be
due to the fact that the water was finally being absorbed by the end of the
test but was not yet filtered out by the kidneys. Our finding of substantially higher peak
lactates following the incremental test in the trials conducted with Mizone
Rapid and Powerade could be a consequence of greater uptake of exogenous
carbohydrate from these drinks than with Mizone and of course water during
the pre-load. If the exogenous carbohydrate led to sparing of muscle glycogen,
lactate could reach a greater peak in the incremental test (Maughan and Poole, 1981) through the athletes being able to push
harder. This explanation could also account for the greater peak heart rates
and peak power with Mizone Rapid and Powerade. The physiological measures taken during the
pre-load did not shed any additional light on the possible explanations for
the differences in performance between the drinks. Tympanic temperature and
heart rate turned out to be extraordinarily sensitive to ambient temperature,
so lack of any substantial effect of the drinks on these variables is
unlikely to be due to problems with measurement. The reviewer requested some discussion of
the issue that double blinding is difficult to achieve successfully with
commercial products, because they can have different tastes, consistencies,
colors and smells. At the time of the study we did not ask the subjects to
guess which drink they were consuming, because our own sampling of the drinks
led us to believe that the success of the blinding was not an issue. Of course there were subtle differences in
taste, but how would these subjects know which drink they were getting unless
they were familiar with the different tastes of the drinks? Even if some
subjects had guessed they were on one of the sports drinks, why would they think
that it was any better or worse than the other drinks? However, given the recent evidence that
carbohydrate receptors in the mouth can enhance performance (Carter et al., 2004; Chambers et al., 2009), we cannot exclude the possibility that
the different performance outcomes with the drinks were due to taste or
stimulation of other receptors rather than to metabolic or circulatory
effects of carbohydrate and salt content. We also agreed with the inclusion of the
following caution from the reviewer about dilution of sports drinks. "It
is possible that in the low range of carbohydrate intakes it is difficult to
see differences in performance. Recent studies have suggested that larger
intakes, in particular of glucose:fructose
mixtures, can result in greater improvements in performance (Currell
and Jeukendrup, 2008; Jeukendrup, 2010; Smith et al., 2010; Triplett et al.,
2010). In endurance competitions (cycling
events, Ironman 70.3, Ironman races, with the exception of marathon) we have
found that athletes tend to have carbohydrate intakes between 60 and 80 grams
per hour (Pfeiffer et al., unpublished). Such intakes cannot be achieved by
low carbohydrate drinks alone, and any use of diluted sports drinks is
usually in conjunction with gels or solid carbohydrate sources, at least for
longer events (Pfeiffer et al., unpublished). It is impossible to conclude
from the current study that low carbohydrate drinks are preferred in all
conditions." In conclusion,
it is clear that a hypotonic sports drink with much less carbohydrate than
the usual isotonic drinks can be an effective ergogenic aid for endurance
performance of an hour or so, provided the drink includes some salt. It seems likely that water from the
hypotonic drink is absorbed more rapidly than the isotonic drink, but more
evidence from a tracer study is needed to resolve this issue. Acknowledgments
Jenny Doyle,
Elizabeth Fox, Matt Wood and Jordan Macintyre provided technical assistance
at various stages of the project.
Frucor NZ provided funding. References
Brouns F, Kovacs E (1997). Functional drinks for
athletes. Trends in Food Science & Technology 8, 414-421 Carter JM, Jeukendrup AE, Jones DA (2004). The
effect of carbohydrate mouth rinse on 1-h cycle time trial performance.
Medicine and Science in Sports and Exercise 36, 2107-2111 Chambers ES, Bridge MW, Jones DA (2009).
Carbohydrate sensing in the human mouth: effects on exercise performance and
brain activity. Journal of Physiology 587, 1779-1794 Coombes JS, Hamilton KL (2000). The effectiveness of
commercially available sports drinks. Sports Medicine 29, 181 Coyle EF (2004). Fluid and fuel intake during
exercise. Journal of Sports Sciences 22, 39-55 Currell K, Jeukendrup AE (2008). Superior endurance
performance with ingestion of multiple transportable carbohydrates. Medicine
and Science in Sports and Exercise 40, 275-281 Galloway SDR, Maughan RJ (2000). The effects of
substrate and fluid provision on thermoregulatory and metabolic responses to
prolonged exercise in a hot environment. Journal of Sports Sciences 18,
339-351 Hopkins WG, Hawley JA, Burke LM (1999). Design and
analysis of research on sport performance enhancement. Medicine and Science
in Sports and Exercise 31, 472-485 Hopkins WG, Schabort EJ, Hawley JA (2001).
Reliability of power in physical performance tests. Sports Medicine 31,
211-234 Hopkins WG, Marshall SW, Batterham AM, Hanin J
(2009). Progressive statistics for studies in sports medicine and exercise
science. Medicine and Science in Sports and Exercise 41, 3-12. Link to PDF. Jeukendrup A, Brouns F, Wagenmakers AJ, Saris WH
(1997). Carbohydrate-electrolyte feedings improve 1 h time trial cycling performance.
International Journal of Sports Medicine 18, 125-129 Jeukendrup A (2010). Carbohydrate and exercise
performance: the role of multiple transportable carbohydrates. Current
Opinion in Clinical Nutrition and Metabolic Care 13, 452-460 Maughan RJ, Poole DC (1981). The effects of a
glycogen-loading regimen on the capacity to perform anaerobic exercise.
European Journal of Applied Physiology 46, 211-219 Maughan RJ, Bethell LR, Leiper JB (1996). Effects of
ingested fluids on exercise capacity and on cardiovascular and metabolic
responses to prolonged exercise in man. Experimental Physiology 81, 847 Maughan RJ, Leiper JB (1999). Limitations to fluid
replacement during exercise. Applied Physiology Nutrition and Metabolism 24,
173-187 Smith JEW, Zachwieja JJ, Peronnet F, Passe DH,
Massicotte D, Lavoie C, Pascoe DD (2010). Fuel selection and cycling
endurance performance with ingestion of [13C] glucose: evidence for a
carbohydrate dose response. Journal of Applied Physiology 108, 1520-1529 Triplett D, Doyle JA, Rupp JC, Benardot D (2010). An
isocaloric glucose-fructose beverage’s effect on simulated 100-km cycling
performance compared with a glucose-only beverage. International Journal of
Sport Nutrition and Exercise Metabolism 20, 122-131 Published Sept 2010 |
||||||||||||||||||||||||||||||||||||||||||||||||||||||||||||||||||||||||||||||||||||||||||||||||||||||||||||||||||||||||||||||||||||||||||||||||||||||||||||||||||||||||